
A sales engineer in the United States earns a median of $124,900 a year, or $60.05 an hour, according to the Bureau of Labor Statistics' May 2025 wage figures. Read that as a base-market reference for the occupation, not as a full earnings figure, because it tells you nothing about pay mix, quota, or what the variable plan paid out.
Most salary advice says to look up the average and negotiate from it. That advice is why offers go sideways. An occupational average covers everything from an implementation-focused SE demoing a mid-market tool to a principal SE running architecture reviews on seven-figure enterprise deals, and it hides the three things that set your number: the percentile your scope sits at, the industry your employer sells into, and the share of your variable target that gets paid.
Start with the benchmarks. Then learn to read them.
Sales Engineer Salary Benchmarks by Source
Ask three salary sources what a sales engineer earns and you get three answers spread across tens of thousands of dollars. Each figure is accurate for the population it measures. The mistake is reading them as one market.
The U.S. anchor is the BLS Occupational Outlook Handbook entry for sales engineers: a median annual wage of $124,900 in May 2025, or $60.05 per hour, about 2.45 times the $50,980 median for all U.S. occupations. The same entry lists a bachelor's degree as the typical entry-level requirement, which matters when your offer competes with candidates who arrived through support or implementation roles.
Every published figure measures something slightly different. Keep them apart.
| Source | Market | Figure | Year | What it measures |
|---|---|---|---|---|
| BLS Occupational Outlook Handbook | United States | $124,900 median ($60.05 per hour) | May 2025 | Median annual wage, including commission and performance pay |
| BLS Occupational Outlook Handbook | All U.S. occupations | $50,980 median | 2025 | Comparison baseline for the occupation |
| PayScale | United States | $85,718 average | 2026 | Average from 562 self-reported salary profiles |
| PayScale | Germany | Self-reported average in euros | 2025 | Different labor market, currency and employer mix |
What the gap between sources tells you
The $39,182 between the BLS median and PayScale's $85,718 comes down to who reported the data. The PayScale U.S. sales engineer page reports an average drawn from 562 self-reported salary profiles in 2026. Self-reported data skews toward people who fill in a profile, and respondents who enter base pay without variable pull the average down. BLS surveys employers across an established occupational category and counts commission and performance pay in the annual wage.
The German row carries a separate warning. PayScale's German data is a self-reported euro average covering all experience levels, produced by a different labor market and a different employer mix, and it sits far below the U.S. figure. Averaging it with an American number produces a figure that describes neither market.
Practical rule: quote one source, state its year, and match it to your market and your role. A midpoint blended across sources and currencies is a number nobody can defend in a comp review.
If you're pricing the role against adjacent technical titles in the same hiring market, browse current developer salary data before you decide that SE pay sits above or below engineering pay at your employer.
Why One Average Misleads and Which Percentile Fits
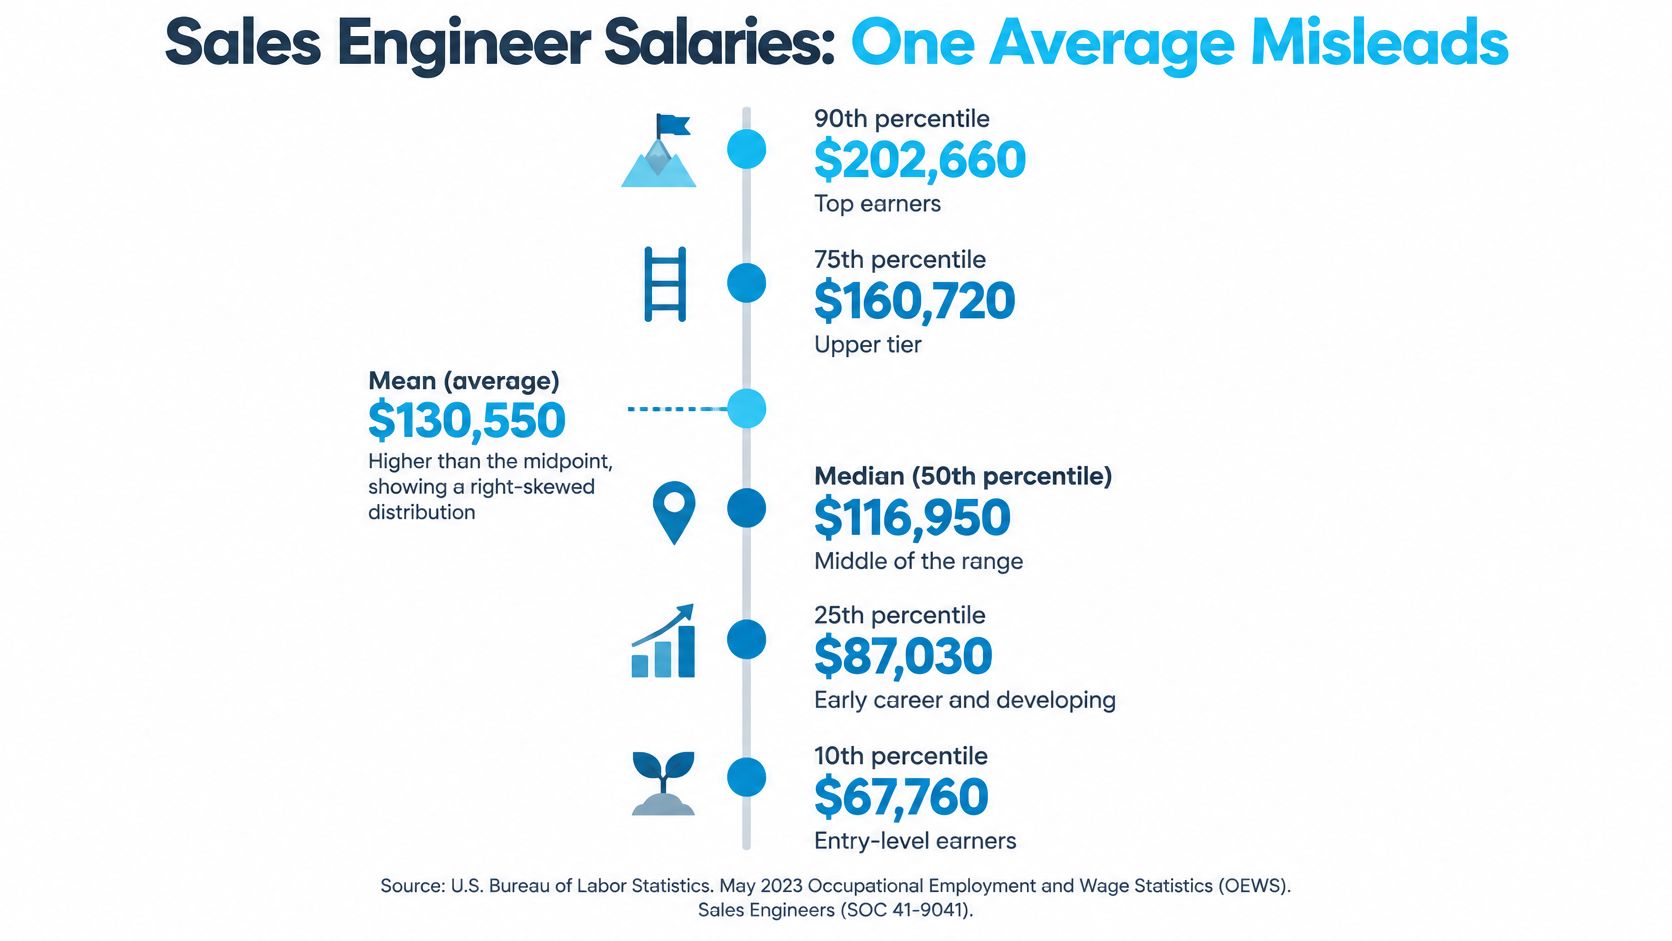
The percentile ladder tells you more than any single average. In the May 2023 Occupational Employment and Wage Statistics release for sales engineers, the 10th-percentile annual wage was $67,760, the 25th was $87,030, the median was $116,950, the 75th was $160,720, and the 90th was $202,660, with a mean of $130,550.
| Percentile | Annual wage | Use it when the role is |
|---|---|---|
| 10th | $67,760 | Entry-level or implementation-focused SE |
| 25th | $87,030 | Early-career SE on standard products |
| Median | $116,950 | Established SE on a mid-complexity product |
| 75th | $160,720 | Senior enterprise SE on complex deals |
| 90th | $202,660 | Strategic SE on the largest accounts and architecture |
| Mean | $130,550 | Reference only, pulled up by high earners |
Two things follow. That release predates the May 2025 median, so don't blend the two into one undated benchmark. And the newer figures show a 10th percentile of $73,870 against a 90th percentile of $195,270, a spread of roughly $121,400 a year, as the BLS occupational summary reports. A title covering a $121,400 spread isn't a pay band. It's a category.
How to choose your row
Three questions settle it: how deep the technical work goes (administering a demo tenant is not designing a data architecture), how large the deals you touch are, and how much of the pipeline your work influences. A broad implementation-focused role sits nearer the lower and middle of the distribution. A senior enterprise SE who owns architecture and executive validation on strategic accounts gets benchmarked against the upper rows.
Say a hypothetical senior SE is the named technical contact in executive reviews and validates seven-figure deals. Compare that person with the 75th to 90th range, not the median. The median describes a mid-complexity product with a standard deal cycle.
Here's how the percentile logic plays out in practice:
Titles overlap across employers, so check the scope before you pick a row. The comparison of sales engineer, solutions engineer and solutions consultant titles is the place to start. A Solutions Consultant at one company may carry the same quota influence as an Enterprise SE at another, and the band should follow the scope, not the words on the offer letter.
How Location and Career Stage Shift Pay
Career stage moves German pay more than expected. PayScale's German pages show average total compensation of €49,149 for early-career professionals with one to four years of experience, based on 43 salaries, and €67,249 for mid-career professionals with five to nine years, based on 24 salaries, per the PayScale Germany early-career page. The difference is €18,100, so the mid-career figure runs about 36.8% higher.
Treat it as directional. Twenty-four salaries is a thin sample, and PayScale's total compensation includes elements such as tips, bonuses and overtime, so it isn't a fixed base salary. The same source family reports €51,324 early-career and €60,000 mid-career on a different Germany page, which shows how much measurement choices move the number inside one publisher.
Compare like with like across borders
Suppose a hypothetical SE in Munich with eight years of experience weighs a remote U.S. offer at the same nominal figure. Neither number means anything until you adjust for taxes, benefits, currency and purchasing power, then check whether the employer localizes pay by employee location, hiring entity or revenue territory. If you're scanning worldwide remote jobs ranked by fit, filter first on whether the employer publishes a location policy at all.
For U.S. roles, no single occupational rate describes every labor market. When your offer sits in a specific region, use state or metro estimates from the BLS Occupational Employment and Wage Statistics program instead of the national figure.
Compare within the same market, the same career stage and the same pay components. Break any one of those three and you create a gap that looks like a negotiation problem when it's a data problem.
If you're mapping pay against the next step in the role, the sales engineer career path overview sets out how scope grows between levels.
Industry Sets the Ceiling More Than Title Does
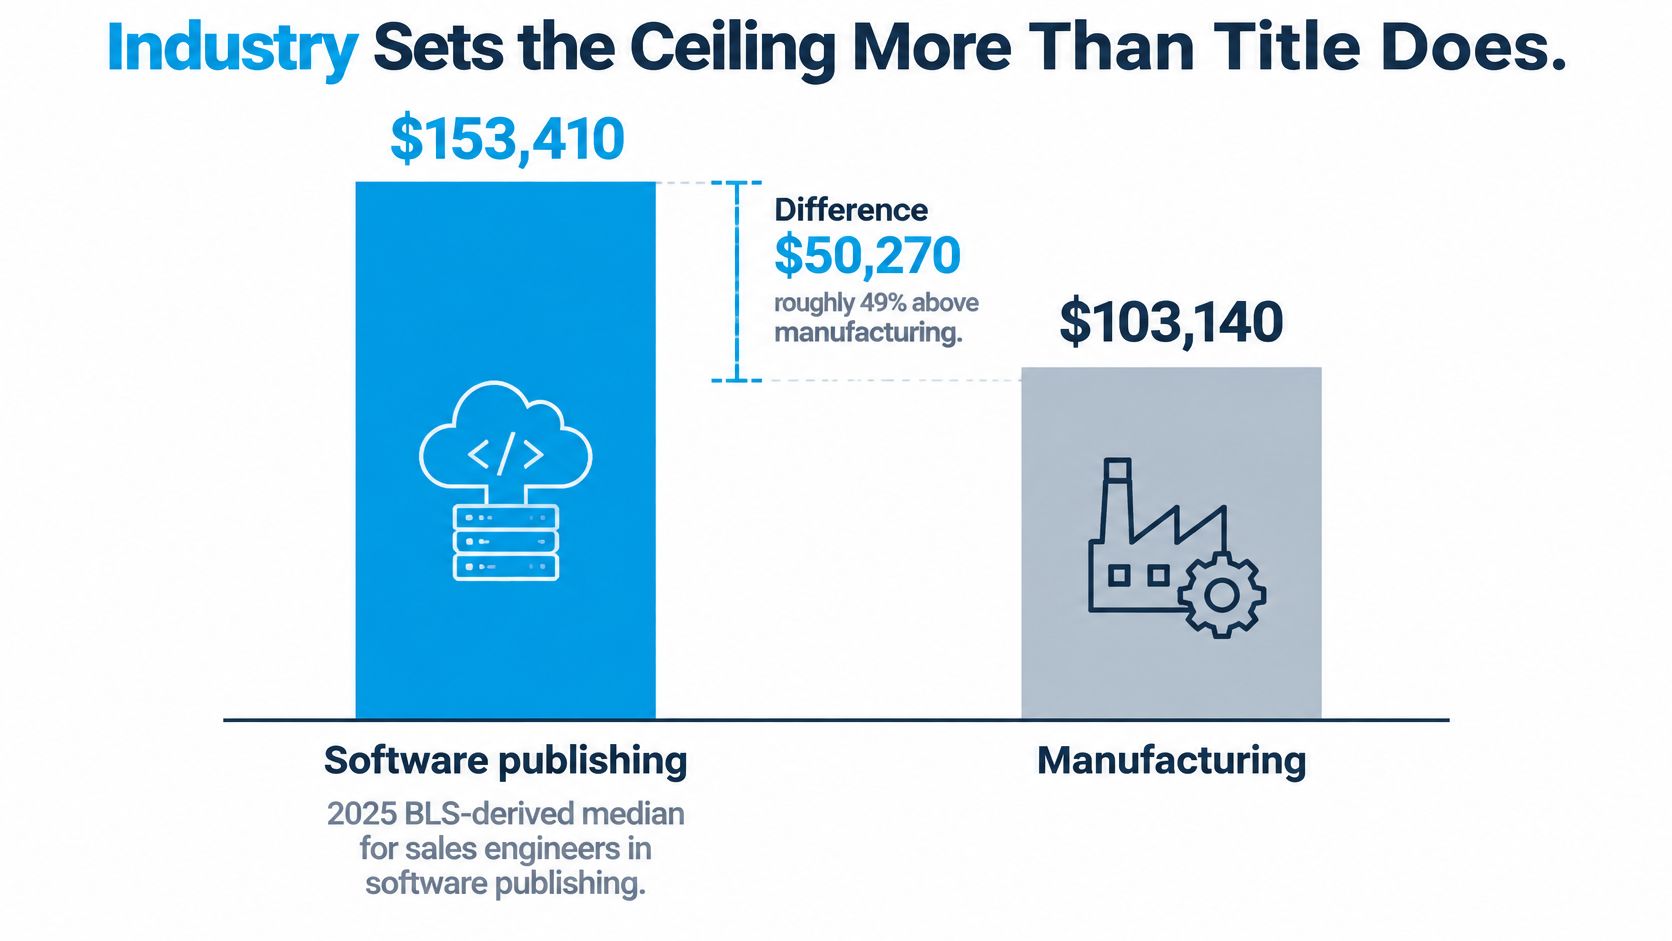
The industry gap is bigger than most title gaps. BLS-derived figures reported for 2025 put the median sales engineer wage in software publishing at $153,410 against $103,140 in manufacturing, a difference of $50,270, or roughly 49% above the manufacturing benchmark, as COBL's sales engineer salary analysis sets out.
| Industry or group | Median annual wage (2025) | Gap against manufacturing |
|---|---|---|
| Software publishing | $153,410 | +$50,270 |
| All sales engineers | $124,900 | +$21,760 |
| Manufacturing | $103,140 | Baseline |
Why software pays more for the same skill
The mechanism isn't that software SEs are better at the job. Software contracts often carry recurring revenue, high gross margins, scalable deployment and large enterprise values, so technical presales work attaches to more commercial weight per deal. Manufacturing carries equal technical complexity but often runs longer capital-equipment cycles with project-specific delivery and different margin structures, which caps what a company can put behind presales influence.
That's a plausible mechanism, not a proven cause, and it's enough to change how you benchmark.
Benchmark base and variable separately
Set base pay against the industry median and the percentile that matches your scope. Then judge variable pay against outcomes you can measure: qualified pipeline supported, technical win rate, proof-of-concept conversion, revenue influenced. Arguing from the North Star of technical win rate turns your work into a figure a compensation committee recognizes.
One check before you assume demand supports a premium. The BLS handbook carries current employment projections for the occupation, so read them. Steady projected demand across the category doesn't create scarcity in your specific domain, and only scarcity in your domain moves your band.
What You Actually Earn Beyond Base Salary
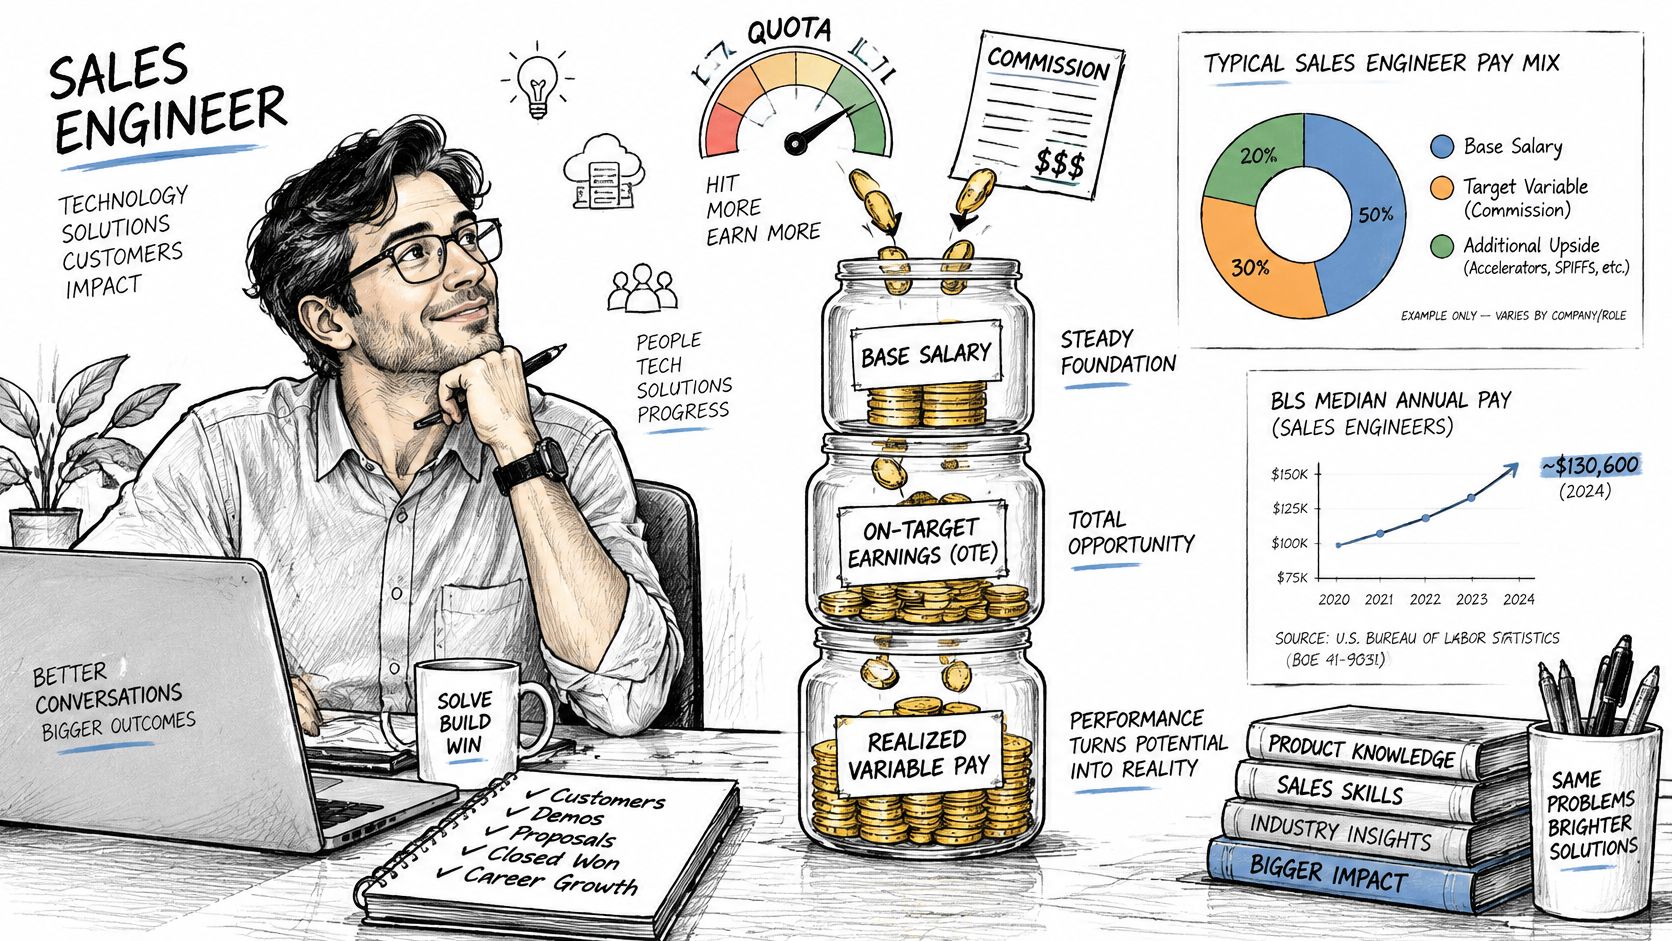
Three terms decide your year, and most job listings fold them into one line. Base salary is fixed. On-target earnings (OTE) is base plus the variable you would earn at 100% of plan. Realized variable pay is what the plan paid out.
The gap between the second and third term is where offers go wrong. The BLS median already blends commission and other performance-related earnings into one figure without showing the pay mix or quota attainment behind it, as the BLS sales engineer occupational profile notes. An OTE number carries the same blind spot at company level. It assumes full attainment, and a team that lands below target turns a strong headline OTE into an ordinary year. Two SEs on identical plans can end the year tens of thousands of dollars apart purely because one team's plan paid out and the other's did not.
So read OTE as a hypothesis, not a figure. The question is what the plan has historically paid on the team you would join.
Six questions that expose a pay plan
- What share of the variable plan has been paid historically across the whole team, not just the rep who hit 140%?
- What is it tied to: bookings, revenue, gross margin, technical win rate, or the account executive's quota?
- What happens to your pay when the AE misses quota on a deal you carried technically for four months?
- Do you own quota or share it, and does your number move when the team's does?
- When is variable paid, and does the timing survive a deal that closes in the last week of the quarter?
- Are there caps or accelerators, and at what point do they start?
Two offers can show the same $150,000 OTE and pay very differently. Say a hypothetical pair lands on your desk: one ties most of its variable to a shared team quota with a weak attainment history, the other to individual bookings with accelerators above plan. Same headline, different job.
Segment offers by product complexity, technical specialization, territory, customer segment and quota influence, because title alone sorts none of that. Then model four inputs: base, target variable, a realistic attainment assumption, and any geographic adjustment. For the third input, use the team's payout history from the first question rather than the plan's 100% target. That modeled figure, run through that model, is the salary you are negotiating.
Levers That Move You Up the Salary Range
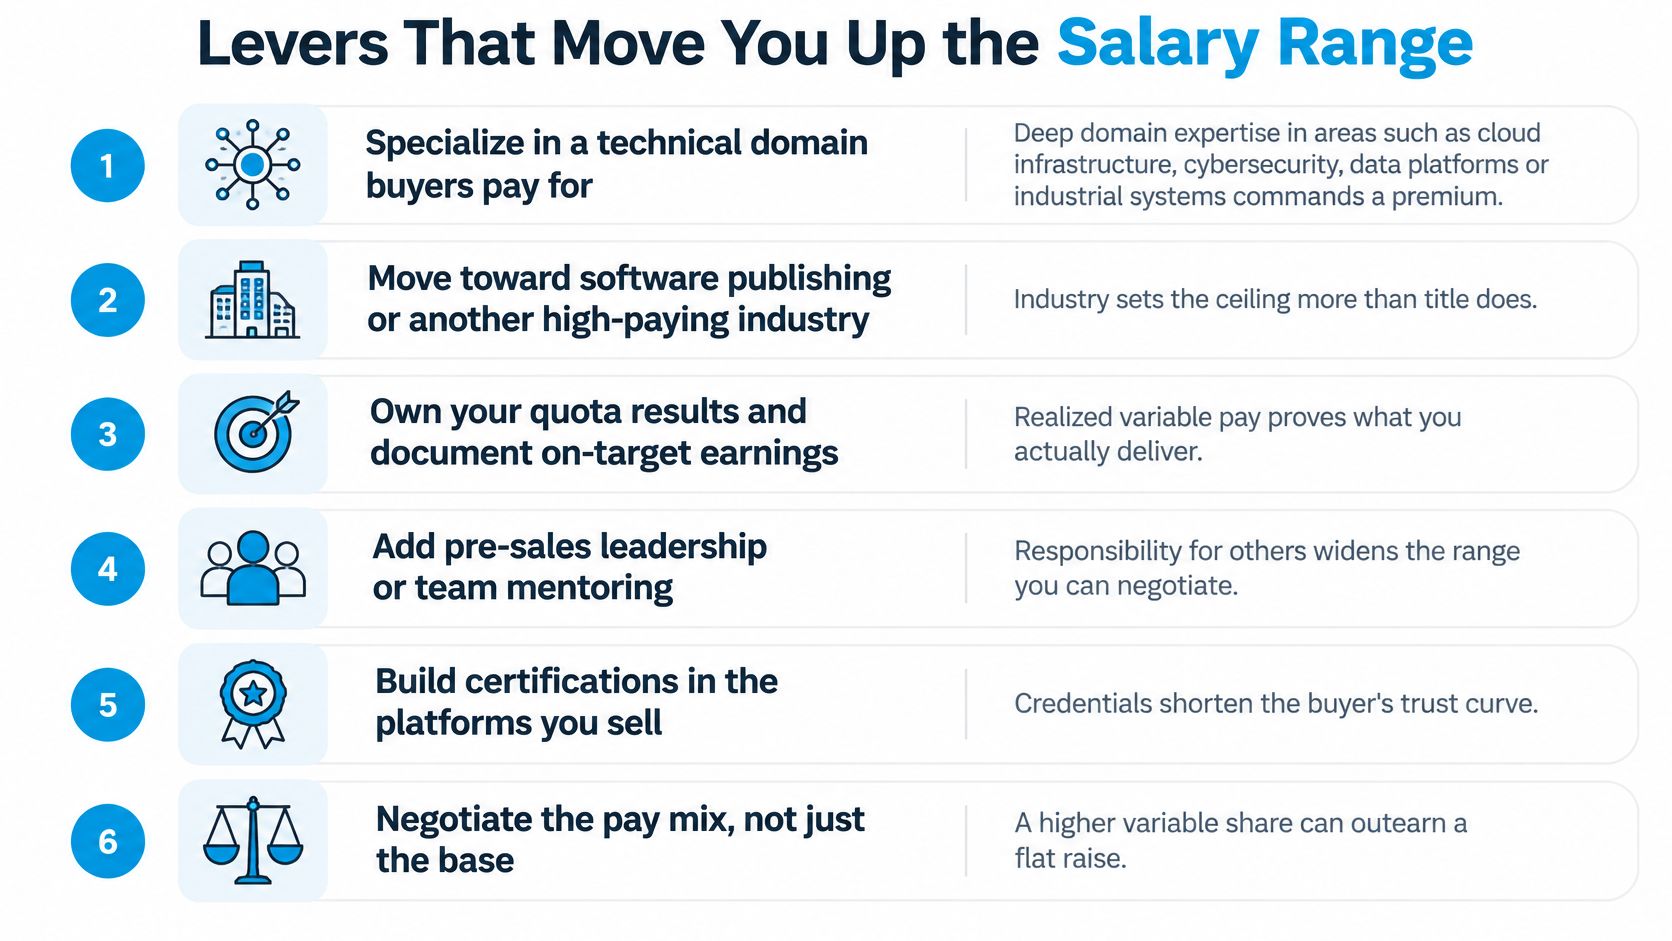
Pay follows scope, and scope follows decisions you make about your own role. Six levers, roughly in order of how fast they move a number.
-
Specialize in a domain buyers pay for. Cloud infrastructure, cybersecurity, data platforms, industrial systems. The premium comes from scarcity of people who can hold an architecture conversation in that domain, not from the word "senior" on your title.
-
Move toward a high-paying industry. A software publisher and a manufacturer pay different bands for the same scope, so the industry you choose does as much work as the level you reach.
-
Own or influence quota. When your variable pay tracks bookings or revenue you helped create, compensation moves with the work instead of with your manager's read of the year.
-
Document outcomes, not activities. Keep your technical win rate and the qualified pipeline you supported in a form you can show on demand. Numbers you can produce at a review are worth more than the ones you remember.
-
Lead discovery early. Discovery quality decides deals more than demo polish, and the SE who shapes requirements in the first call is the SE who can later point at the deals they defined. The discovery call guide covers the structure.
-
Move into leadership deliberately. Leading an SE team is a role change, not a promotion. Leader pay follows proof that you managed outcomes through other people, so walk in with the win-rate and pipeline numbers that show it.
A new title with no change in scope, quota or technical depth rarely changes the offer. If the band didn't move, the scope didn't either.
Before your next review, test one lever you can evidence inside a quarter. Specialization and documented win rates usually move fastest, and a title change is the slowest. Write the case the way the sales engineer resume guidance suggests: outcomes first, tools second.
Benchmark Your Offer Before You Sign
Run the same six checks on every offer, in this order.
- Fix the market and the source. One source, one year, one geography. A U.S. national median doesn't transfer to a Munich offer.
- Pick the percentile that matches the scope. Technical depth, deal size, pipeline influence. The row you choose matters more than the source you choose.
- Convert to total cash. Base plus target variable multiplied by a realistic attainment rate. Never the target at 100%.
- Run the six plan questions on quota ownership, payment timing, caps and accelerators. An answer you can't get in writing is an answer you don't have.
- Check the sector median for the employer's industry, from the same year as your reference source.
- Decide. Accept, negotiate base or variable terms, or walk away.
Worked example with round numbers
Take a hypothetical U.S. offer of $120,000 base and $60,000 target variable at an assumed 70% attainment. Expected cash is $162,000.
Which row do you hold it against? For senior enterprise scope, compare it with the May 2023 75th percentile of $160,720. For a mid-complexity product with a standard cycle, the May 2023 median of $116,950 is the right row, and $162,000 looks strong.
Keep each year's source on its own row. The 2023 ladder and the May 2025 median come from different releases, and mixing them turns a defensible case into a guess.
No published average replaces the offer's pay plan. The plan is the contract. The average is only the opening position for the conversation.
If you want to test your pay case against a structured program, book a discovery call or work through the Trusted Advisor Academy, which has trained 350+ Solution Engineers and draws on more than 25 years of sales engineering in B2B software sales.
PreSales Unleashed GmbH runs the Trusted Advisor Academy, a year-round program that develops Solution Engineers on discovery, technical validation and the outcomes that justify a higher band. If you're building the case for your own scope or your team's, bring your technical win rate and pipeline numbers and we'll pressure-test them against the same measures we use every week with the teams we coach. Visit PreSales Unleashed GmbH to see how the program works.