
A KPI dashboard is only useful if it changes a deal. Counting demos, meetings, and hours can tell you that the team was busy, but it can't tell you whether PreSales changed the buyer's evaluation or helped create a technical win.
That distinction matters because no discovery means no demo. A polished presentation delivered without a clear understanding of the buyer's problem, decision process, technical requirements, and success criteria often creates activity without progress. Strong KPI reporting starts upstream with discovery quality, then follows execution, technical outcomes, competitive learning, capacity, and team development.
The metrics examples for GTM teams are useful only when they connect to a decision. The eight KPI reporting examples below treat every report as a decision instrument, not a collection of charts.
Read each example in five ways: define the metric, review the sample layout, interpret the signal, choose a presentation format, and assign the next action. Any numerical scenario from the examples is explicitly hypothetical or illustrative. Real reporting requires consistent CRM definitions, a known denominator, accountable owners, and evidence behind every classification.
1. Technical Win Rate Dashboard
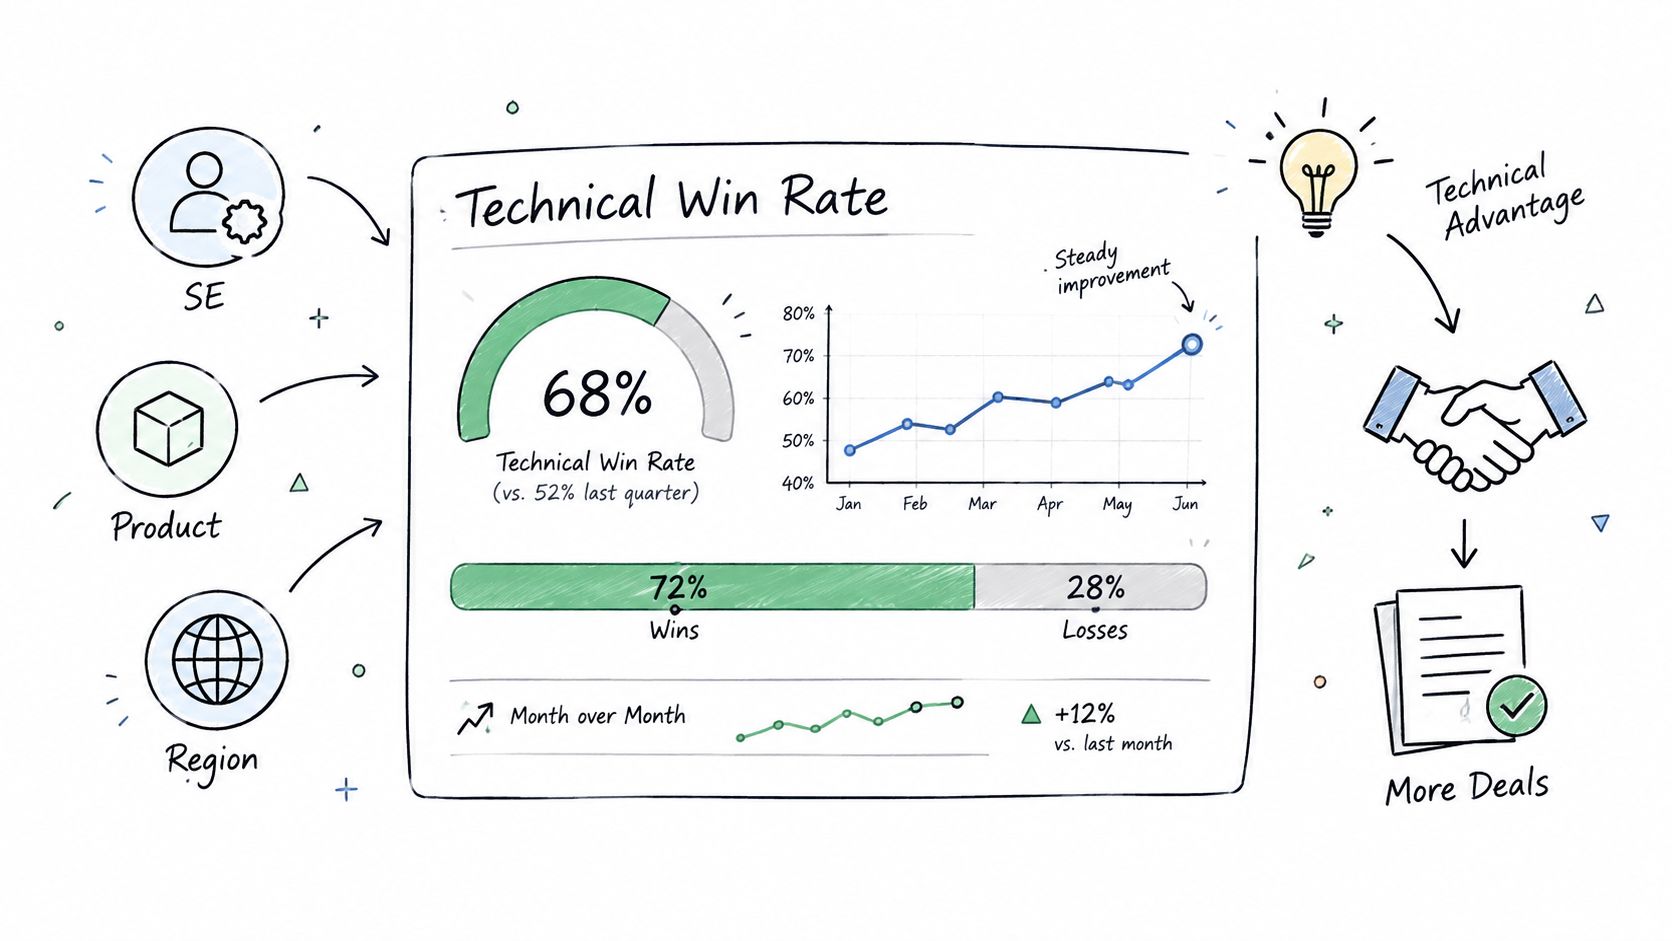
Technical win rate should be the primary outcome measure for a Solution Engineer (SE) team. It asks whether PreSales created a decisive technical advantage that influenced the buyer's decision, rather than whether an SE completed a certain volume of activity.
Define the outcome before building the dashboard. A technical win might mean that the buyer selected your architecture, removed a technical blocker, accepted your approach during security review, or progressed after a competitive evaluation. The definition must be written into the metric dictionary, because “technical win” can otherwise mean something different to every AE and SE.
A useful sample view includes:
- Current technical win rate: Technical wins divided by opportunities with SE involvement.
- Trend: Performance over the selected reporting period, with the period and cohort definition visible.
- Breakdowns: Product line, deal stage, region, market segment, and SE.
- Evidence: Technical success criteria, decision notes, competitor status, and closed-won or closed-lost outcome.
- Action queue: Deals requiring technical review, missing outcome tags, or unresolved loss reasons.
The technical sales engineering measurement framework recommends pairing technical win rate with attachment rate, technical milestones, engagement duration, loss reasons, and SE capacity. That combination prevents leaders from treating one aggregate percentage as a complete account of performance.
What the signal means
A falling rate can point to weak discovery, poor qualification, a product gap, late SE attachment, or inconsistent technical success criteria. It doesn't automatically prove that SE execution caused the loss. Compare cohorts carefully and inspect deal notes before changing the playbook.
Use pre-call planning to identify the buyer's technical decision criteria before the first meeting. Review the report monthly in AE and SE deal sparring, then ask which discovery question, technical milestone, or architecture concern shaped the result.
2. Discovery Quality Scorecard
Discovery quality is the leading indicator most activity dashboards miss. Before a demo, the SE should understand the business problem, technical environment, evaluation process, timeline, stakeholders, and competitive context well enough to shape a relevant technical path.
A scorecard makes that standard observable. The categories should be agreed with experienced SEs, AEs, and sales managers, not imposed by a reporting administrator who doesn't participate in discovery. The discovery call guide can help teams define the questions and behaviors that belong in the scorecard.
An illustrative scorecard might use a 25-point scale, with five points each for business context, technical requirements, evaluation process, budget and timeline, and competitive position. A hypothetical team might flag any opportunity scoring below 18 points for manager coaching before a demo is scheduled. Those figures are examples of a local operating rule, not a universal benchmark.
Sample scorecard view
Show the score beside the opportunity, SE, account segment, call date, and reviewer. Add a short evidence note for every category. “Good discovery” isn't evidence. A note such as “security owner requires SSO and audit export before technical approval” is evidence.
Grade a consistent sample of calls, using recordings only with buyer consent. Review the score alongside technical win rate and cycle time, but don't claim that a high score caused a win without checking cohort quality and deal context.
Practical rule: If the scorecard can't tell an SE what to ask next, it isn't a coaching tool yet.
The 2025 BARC BI & Analytics Survey warns that KPIs based on small, nonrepresentative samples can distort graph scales and mislead interpretation. Add sample size, cohort definition, data completeness, and a “do not interpret” threshold to the scorecard. The survey document supports treating weak samples as a reporting risk, not as a performance conclusion.
Place the image near the scorecard introduction, then use the video later as a discussion prompt for manager training.
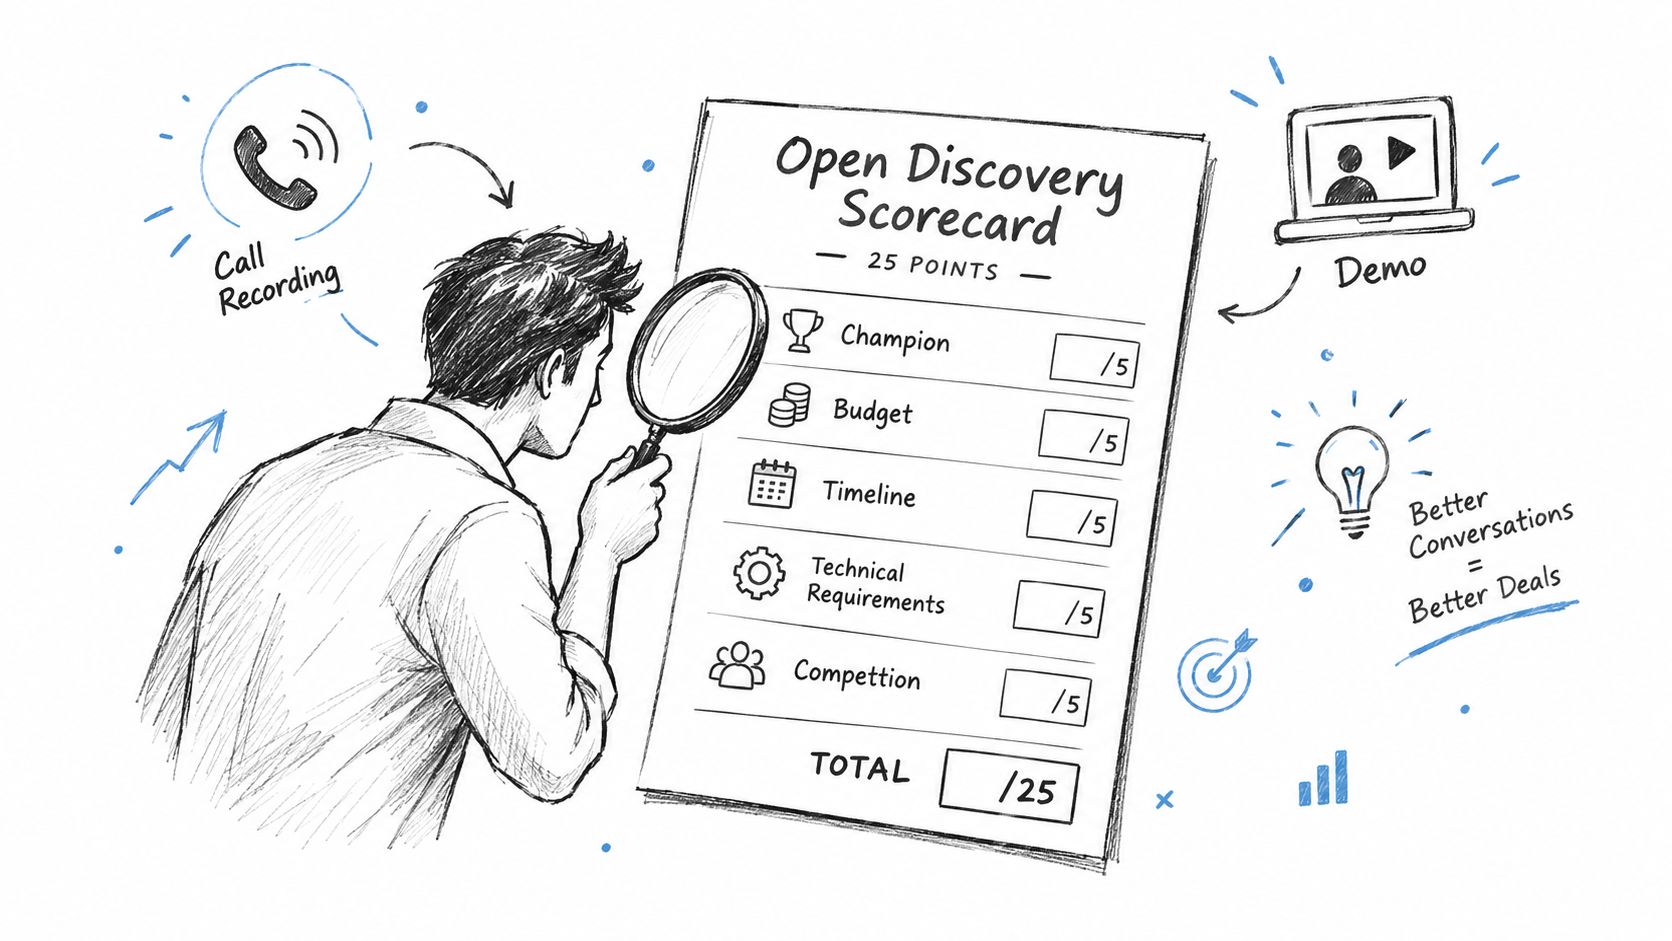
A manager can use the report in a weekly review with three questions: What did the buyer say that changed the technical path? Which required question was missed? What will the SE do before the next customer interaction?
3. SE Capacity Utilization and Allocation Report
A full SE calendar can hide poor allocation. Time may be absorbed by generic demos, unqualified RFPs, internal meetings, or open-ended POCs while high-value opportunities wait. The report should show which work receives attention and whether that allocation supports technical progress.
Start with a weekly allocation view:
| KPI view | Signal | Decision |
|---|---|---|
| Time by activity | Hours spent on discovery, demos, POC support, validation, proposal review, handoff, enablement, and administration | Remove repeatable work, improve qualification, or assign specialist support |
| Time by stage | Concentration in discovery, evaluation, POC, negotiation, or post-sale handoff | Shift coverage toward stages with the greatest deal impact |
| Queue health | Opportunities waiting for SE attention, including age and priority | Reorder work or set a scheduling rule |
| Capacity exceptions | Allocation above the agreed limit or deals without a clear next step | Escalate, re-scope, or decline low-value requests |
| Outcome context | Technical wins, pipeline velocity, or evaluation progress by allocation pattern | Test whether busy periods produce technical progress |
Connect each activity to an opportunity ID whenever possible. Without that link, leaders can measure effort but cannot assess attribution. A technical win may reflect strong discovery, product fit, territory quality, or buyer urgency rather than the amount of SE time assigned. Compare cohorts with similar role, stage, territory, and deal complexity before changing staffing or targets.
A documented CRM-linked model at mus.to ingested activity logs into Google Sheets every five minutes, filtered records by representative and role, and calculated funnel conversion rates from actual pipeline behavior. The organization reported revenue growth of more than six times over four years. Use this as an example of reporting architecture, not as an expected result for another SE organization.
Use the report to make allocation decisions
If discovery queues age while demo calendars remain full, possible responses include tighter qualification, reusable technical assets, different scheduling rules, or additional staffing. Hiring should follow evidence that demand exceeds available capacity after process changes.
Compare SEs within relevant cohorts. A new SE, senior SE, and specialist may handle different deal profiles, so a single utilization target can reward the wrong behavior. Review allocation in the weekly SE standup, then apply the resource allocation guidance for business operations.
Pair utilization with discovery quality, milestone attainment, and technical wins. Capacity reporting becomes useful when it shows whether time is creating customer progress, not merely filling calendars.
4. Proof of Concept Success Rate and Time-to-Value Report
A POC report should control the evaluation, not just record the result. Success rate alone can hide weak scoping, vague acceptance criteria, or a buyer who never had sign-off authority. Duration alone can punish complex use cases that were qualified correctly.
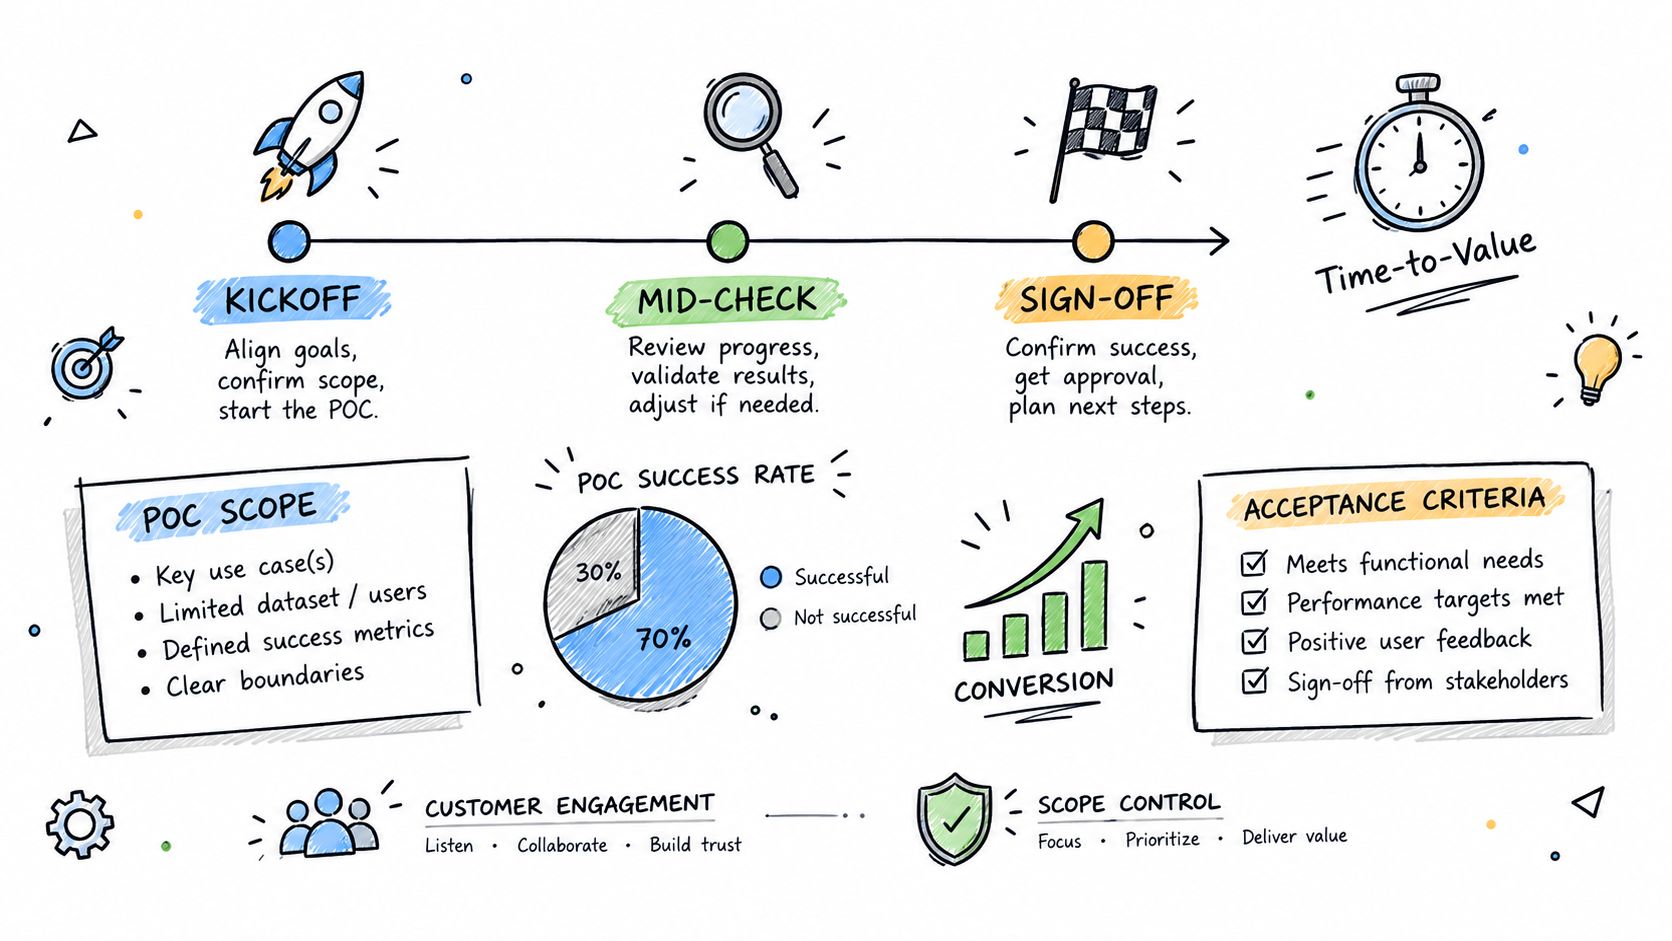
Define success at kickoff with the buyer. Capture written acceptance criteria, pass or fail thresholds, test owners, timeline, dependencies, and the person responsible for sign-off. Keep those fields in the CRM or evaluation workspace, not in an email thread that no one can audit later.
A useful report should show the status, the timing, and the reason a POC moved or stalled:
- POC status: Planned, active, at risk, successful, unsuccessful, paused, or abandoned.
- Time-to-value: Time from kickoff to the first agreed proof of business or technical value.
- Duration: Time from kickoff to final sign-off.
- Success factors: Use case, technical environment, data access, stakeholder participation, and scope changes.
- Commercial follow-through: Next commercial step, expected decision date, and closed-won or closed-lost outcome.
A report can also show change over time. One example might compare a 65% success rate over an eight-week average with a later 78% success rate over six weeks after introducing a POC Charter. Treat those figures as hypothetical examples. They show what to compare, not a benchmark for your team.
What the report should trigger
Use the report to set a decision point, not a celebration point. If a POC reaches its review date without evidence of progress, the SE, AE, and buyer should decide whether to pause, narrow scope, change success criteria, or exit the opportunity.
A successful POC is not the same as a commercial win. Pair this report with post-POC deal velocity and the time from sign-off to purchase. A high technical success rate can still signal weak qualification if buyers do not move to a commercial decision.
Use the sales engineer KPI guidance to connect POC execution with technical win rate, milestone completion, and capacity. The visual should highlight aging and exceptions, not hide stalled evaluations inside a funnel.
5. Deal Influence and Win Factor Attribution Report
A win factor report turns closed-deal outcomes into decisions about discovery, technical proof, and SE coaching. It links buyer concerns, product gaps, technical narratives, and SE actions to the result, while allowing for several causes instead of forcing every deal into one explanation.
Build the report around a sample KPI view that combines structured fields with evidence:
- Primary technical factor: The factor most connected to the decision.
- Secondary factor: A contributing issue or strength.
- SE influence: None, low, medium, or high, supported by specific evidence.
- Discovery source: The meeting, question, or artifact where the factor first appeared.
- Response: Discovery question, demo path, POC test, architecture review, or product change.
- Outcome: Technical win, commercial win, technical loss, or disqualified opportunity.
Capture these fields at close, while the AE and SE can still verify the sequence of events. Ask the buyer or lost prospect, when appropriate, which technical factor influenced the decision. Use specific categories such as migration risk, security architecture, integration depth, compliance requirements, implementation complexity, or performance requirements.
An illustrative report might review 20 closed deals and identify regulatory compliance architecture in 8, legacy-system migration in 6, and vendor stability in 4. It might also record missing security certifications in 3 losses and API documentation gaps in 2. These hypothetical figures demonstrate report structure, not market performance.
Read the signal, then test attribution
A recurring factor should change an action. Repeated security concerns justify an earlier security discovery path and a named documentation owner. Frequent migration concerns call for a technical validation sequence before a buyer commits to a POC. A factor tied to high SE influence may indicate a reusable technical win pattern. A factor tied to low influence may point to qualification, product, or enablement work instead of individual coaching.
SE involvement does not prove SE causation. An SE may receive credit for a deal that was already strongly positioned, while an AE may communicate technical value without recording the SE contribution. Compare buyer feedback, discovery evidence, technical interventions, and their timing before assigning influence.
Use the report to improve questions, demo design, technical stories, and coaching priorities. Its output should be a clearer response to recurring risks and fewer repeated losses, rather than a ranking of “influential” SEs.
6. Sales Cycle and Deal Velocity Benchmark Report
Cycle time matters only when you know what happened to quality. An SE team that shortens evaluations by skipping discovery may report faster deals and create more late-stage losses. Review velocity alongside technical win rate, POC outcomes, and customer feedback.
Start with consistent CRM timestamps. Record first SE engagement, discovery completion, technical milestone dates, POC kickoff, POC sign-off, commercial proposal, and close. Separate time that the SE can influence from procurement, legal, security, or buyer scheduling delays.
Pipeline velocity provides a useful composite measure. HubSpot's sales pipeline guidance defines it as:
(Number of opportunities × average deal size × win rate) ÷ sales-cycle length
The same source gives an illustrative calculation using 20 opportunities, a $10,000 average deal size, a 40% win rate, and a 50-day sales cycle, producing $1,600 per day of pipeline velocity. Those numbers belong to the source's worked example. Use your own consistently defined opportunity population, deal-value basis, win rule, and time convention in production reporting.
Read the components, not only the composite
A higher velocity result can come from more qualified opportunities, larger deals, better conversion, or shorter cycles. The report must display all four component measures beside the calculated result. Otherwise, leaders may ask SEs to move faster when the core issue is poor qualification or weak deal value.
Segment cycle time by product, market, use case, deal complexity, region, and SE attachment timing. Median time can be more informative than an average when a few unusually long evaluations distort the view, but the report should still display the cohort definition and exclusions.
Use the timeline infographic to explain where work accumulates, then ask one operational question in every deal review: what is the next controllable technical decision?
7. Competitive Displacement and Win-vs-Competitor Report
A competitor win rate is useful only when it changes a technical decision. A field that records the competitor's name cannot show why the buyer chose one option, where the evaluation shifted, or what the SE team should change in discovery and proof.
Build the report around the decision, not the competitor label. Require these fields at close:
- Competitor considered: Primary and secondary alternatives.
- Competitive outcome: Won, lost, no decision, or unknown.
- Technical factor: Architecture, integration, security, performance, usability, migration, or another defined category.
- Stage of displacement: Discovery, technical validation, POC, security review, or commercial evaluation.
- Deal context: Product, segment, use case, deal size band, and cycle duration.
- Enablement action: New discovery question, demo path, battlecard update, technical asset, or product escalation.
A buyer choosing no vendor belongs in a separate outcome. Treating no decision as a competitive loss can make product fit or project timing look like a positioning problem.
Sample KPI view
| Competitor | Win rate | Main technical factor | Displacement stage | Action |
|---|---|---|---|---|
| Competitor A | 78% | Integration | Technical validation | Reuse the proof path |
| Competitor B | 52% | Security | Security review | Improve discovery and technical evidence |
A hypothetical training intervention could raise the second result to 61% over two quarters. These figures are examples, not verified benchmarks, and should not be presented as expected outcomes. The useful output is the action: strengthen security discovery, prepare clearer evidence, or escalate a recurring product gap.
Where attribution fails
Competitive win rate can move because of deal mix, qualification, pricing, product fit, or changes in who enters the pipeline. A higher rate after training does not prove that training caused the improvement. Review the underlying opportunities and compare similar cohorts before changing positioning or assigning coaching work.
Ask SEs who win difficult competitive deals to document the discovery path, technical proof, and objection handling that shaped the result. Test those patterns in roleplays and active opportunities. Escalate repeated product or documentation gaps with evidence from the report, rather than a general claim that “the competitor is better.”
The report earns its place when it improves the next technical conversation.
8. SE Coaching and Skill Development Tracker
A coaching tracker should drive the next deal decision, not serve as a private report card. A low win rate or long cycle time identifies a symptom. The manager still needs to determine whether the cause is discovery, technical communication, POC control, qualification, or deal strategy.
Start with one behavior and its evidence:
| Coaching focus | Evidence to capture | Decision signal |
|---|---|---|
| Discovery | Scorecard and call review | Poor problem definition may weaken qualification |
| Technical storytelling | Demo feedback and deal review | Buyers may not connect capabilities to their architecture |
| POC management | Milestones and execution notes | Uncontrolled evaluations may extend cycle time |
| Competitive positioning | Loss factors and technical objections | The team may need better evidence or objection handling |
Add the connected KPI, a practice action, a review date, and the next adjustment. Practice actions can include roleplay, deal sparring, call review, shadowing, or asset creation. The next adjustment should state whether to continue, change, or retire the intervention.
An illustrative tracker could show three SEs moving from 15 out of 25 on a discovery scorecard to 20 out of 25, while win rate moves from 58% to 68% after repeated deal sparring. A team-level view might show 64% changing to 69%. These figures are hypothetical. They show the layout and the decision to examine, not proof that coaching caused the outcome.
Use the tracker in one-on-ones
Keep the individual view private and developmental. Leadership can review aggregated results, while public rankings risk turning customer conversations into metric optimization.
The SE should select a small number of behaviors, bring evidence from live deals, and explain what changed in the next customer interaction. The manager then checks whether the related KPI moved, whether the opportunity mix changed, and whether another factor explains the result. Win rate, cycle time, technical milestone completion, POC execution, and loss factors provide context rather than a verdict.
Set a review date and record the next adjustment. This creates a coaching loop tied to discovery quality, technical judgment, and customer outcomes.
The SE Rockstars community and its Trusted Advisor Academy offer structured practice, deal sparring, and KPI-oriented enablement for teams that need support beyond a quarterly training event.
Comparison of 8 KPI Reports
| Item | Implementation Complexity | Resource Requirements | Expected Outcomes | Ideal Use Cases | Key Advantages |
|---|---|---|---|---|---|
| Technical Win Rate Dashboard | Medium–High, requires attribution rules and analytics | CRM tagging, historical win/loss data, analytics tool, AE/SE input | Correlates SE activity to revenue; highlights high-impact practices | Enterprise deals, proving SE ROI, leadership reporting | Direct link between technical contribution and revenue; prioritizes coaching |
| Discovery Quality Scorecard | Medium, build rubric and calibrate graders | Scorecard template, call recordings, reviewer time, CRM integration | Better qualification, fewer wasted demos, targeted coaching | Teams needing stronger pre-demo qualification or onboarding SEs | Catches misalignment early; provides concrete feedback for SEs |
| SE Capacity Utilization & Allocation Report | Medium, time-tracking and dashboarding | Time logs or CRM fields, automated rollups, manager reviews | Visibility into capacity, informed hiring or reassignment decisions | Workload balancing, staffing justification, high-volume pipelines | Reveals bottlenecks and low‑ROI work; supports staffing arguments |
| POC Success Rate & Time-to-Value Report | Medium, standardize POC criteria and tracking | POC charters, CRM tagging, customer engagement tracking, follow-ups | Higher POC success, shorter durations, improved qualification | POC-heavy sales cycles, technical evaluation scenarios | Early indicator of purchase intent; improves scoping and gating |
| Deal Influence & Win Factor Attribution Report | High, qualitative tagging and structured interviews | Win/loss calls, detailed CRM tags, analyst time, cross-functional review | Identification of technical narratives that drive wins or losses | Mature orgs codifying playbooks and technical positioning | Shows why deals close; informs demos, content, and training |
| Sales Cycle & Deal Velocity Benchmark Report | Medium, timestamp automation and segmentation | CRM stage timestamps, analytics, periodic review meetings | Identifies phase bottlenecks; measures SE impact on cycle time | Teams optimizing velocity and capacity planning | Exposes speed-related issues and phase-specific delays |
| Competitive Displacement & Win-vs-Competitor Report | Medium, disciplined competitor tagging | CRM competitor fields, win data, SE input, coaching sessions | Improved positioning, targeted competitive coaching, product feedback | Highly competitive markets and frequent head-to-head deals | Directs messaging and product priorities; highlights competitor gaps |
| SE Coaching & Skill Development Tracker | Medium–High, integrates multiple metrics and feedback | Performance dashboards, feedback collection, manager coaching time | Measurable SE improvement, validated training ROI, mentor identification | Organizations investing in enablement and continuous improvement | Links development activities to outcomes; enables precision coaching |
Turn the Report Into the Next Deal Decision
Eight reports don't create an operating rhythm by themselves. They create value when a named person reviews the signal, decides what it means, and changes an active deal, a staffing decision, a technical asset, or a coaching plan.
Use discovery quality as the upstream signal. If discovery is weak, don't respond by asking SEs to deliver more demos. Inspect qualification, buyer context, evaluation criteria, and technical requirements first. The what PreSales means in a modern revenue team guide can help align sales and PreSales around the work that happens before technical presentation.
Use technical win rate and win factors as outcome measures. Technical win rate tells you whether the team is creating decisive technical value. Win factor attribution explains which buyer concerns, technical narratives, and product gaps shaped the result. Review both with deal notes and customer evidence, because neither metric can prove causation on its own.
Use capacity and velocity for resource decisions. Capacity shows whether the team is spending time on discovery, technical validation, POCs, and other work that affects progression. Velocity combines opportunity volume, deal value, conversion, and time, but leaders should always inspect the component measures rather than managing to the composite alone.
Use POC reporting to control evaluations. Every POC needs a buyer-agreed definition of success, a sign-off owner, a decision date, and a clear response when progress stalls. An open-ended POC consumes capacity and can create false confidence in technical progress.
Use competitive reporting for positioning. Record the competitor, the technical factor, the evaluation stage, and the evidence behind the outcome. Then turn recurring loss factors into discovery questions, demo scenarios, product requests, and enablement content.
Use coaching data for behavior change. A manager should be able to connect a missed technical win to a behavior that can be practiced, observed, and reviewed again. The technical win rate guide and MEDDPICC guidance for Solution Engineers offer useful frameworks for connecting deal execution to measurable outcomes.
Start with one outcome report and one leading indicator. For example, pair technical win rate with discovery quality, or POC success with milestone attainment. Define the metric, denominator, owner, CRM fields, reporting cadence, sample-size threshold, and action threshold before choosing colors or charts.
A 2010 TDWI survey collected responses from 222 business-intelligence professionals and business users. In that survey, 74% said data visualization produced a “very high” or “high” increase in business-user insights, according to Tableau's visual reporting and analysis reference. The result supports a useful design principle, but it came from a defined respondent group and shouldn't be treated as a universal estimate.
A dashboard should also distinguish completeness from accuracy. The UK Government Data Quality Framework defines completeness as the presence of required records and values, while accuracy concerns whether the data matches reality. A populated CRM field doesn't prove that the opportunity stage, technical outcome, or deal value is correct. Add freshness and data-quality checks to every report that informs leadership decisions.
Selecting the right KPI is often harder than building the chart. One cited KPI-dashboard survey found that 32% of respondents identified choosing the right KPIs as the most challenging part of performance measurement, as described in this dashboard visualization reference. Give every KPI a business goal, audience, source, owner, target basis, cadence, and action threshold.
For structured team practice, the PreSales training selection guide can help leaders compare ongoing enablement with one-off workshops. The right choice depends on your operating problem, available time, manager involvement, and need to apply learning to active opportunities.
Take the first step with one active pipeline segment. Document the metric definition and denominator, audit the required CRM fields, assign the owner, and schedule the first review with the SE and AE team. If the report doesn't produce a specific decision in that meeting, change the report before adding another KPI.
PreSales Unleashed GmbH offers the Trusted Advisor Academy, ongoing PreSales training, live deal sparring, roleplays, discovery practice, and KPI tools for Solution Engineers and SE leaders. Visit PreSales Unleashed GmbH to connect reporting with observable behavior change and active deal execution.