
Stop counting demos. Start measuring technical wins. Demo volume, meeting counts, and utilization alone can't prove Solution Engineer (SE) impact. They tell leadership how busy the team was, not whether technical work changed a buyer's decision, protected deal quality, or built customer trust.
A useful sales engineer KPI framework starts with the outcome PreSales owns: the technical win. Measure discovery before delivery, qualification before capacity allocation, evaluation progress before revenue attribution, and customer trust after the sale. That sequence keeps the report tied to decisions you can make.
Every KPI in this list follows the same operating model: define it, state the formula, show a hypothetical example, identify the data source, connect it to a decision, and add a guardrail. All numerical examples are hypothetical. External benchmarks require a named, linked source. For wider measurement context, compare this framework with this guide for data teams.
Start with the distinction between what PreSales is and the technical win rate framework. The point isn't to create a larger dashboard. It's to build an operating system for technical wins.
1. Technical Win Rate
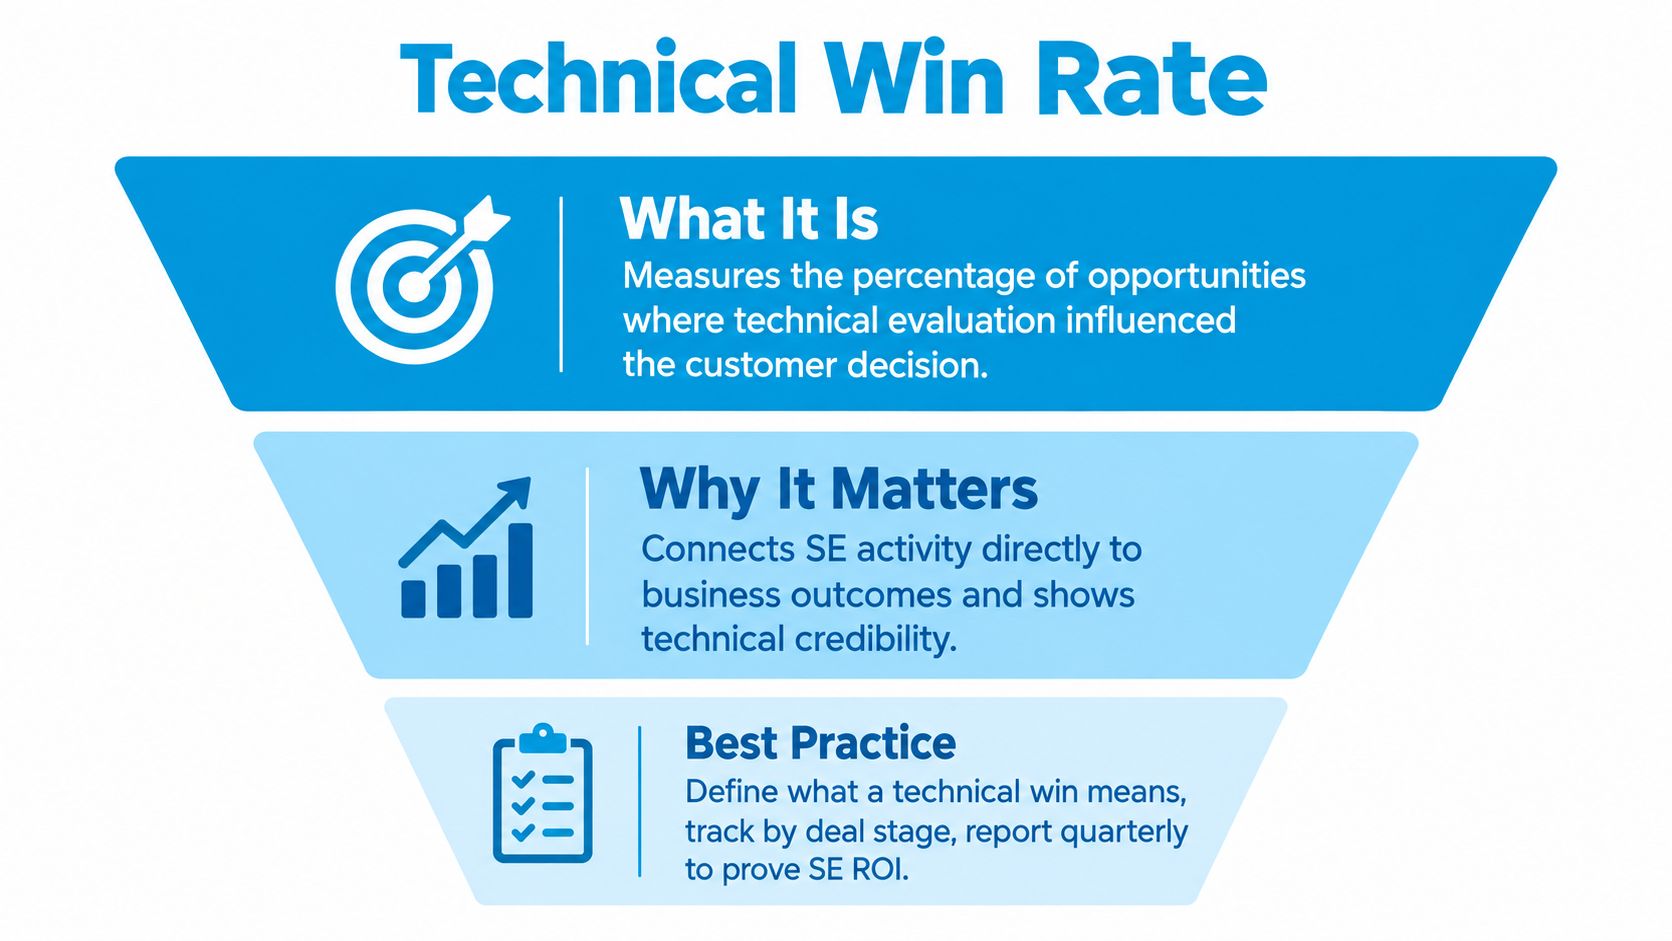
Technical win rate is the north-star sales engineer KPI because it measures whether the customer accepted your technical position, architecture guidance, or proof of capability. It isn't the same as closed-won rate. A deal can close for commercial, executive, or relationship reasons even when the technical evaluation was weak. Your report should isolate the moment when the buyer decided that your solution met the technical bar.
Define a technical win before you calculate it. A practical formula is:
Technical win rate = technical wins ÷ opportunities with SE involvement × 100
The numerator might include opportunities where the customer confirmed solution fit, approved the architecture, completed technical validation, or recommended your product internally. Use one definition across regions and segments. If AEs can't answer whether the technical decision favored you, your CRM taxonomy isn't ready.
Ask the AE at close, “Would we have won this deal without SE involvement?” Record the answer with evidence, not as a casual opinion. Track the rate by discovery, demo, and POC involvement so you can see where technical work changes the deal.
Practical rule: A technical win must describe a buyer decision, not an SE activity.
Review losses by technical objection, missing capability, security concern, or implementation risk. Then report the metric to leadership on a regular operating cadence, with the sample size, segment, involvement point, and loss reason attached. A polished demo can't compensate for weak discovery, so prioritize demo skills training only after you know whether the demo addressed a confirmed technical need.
2. Discovery Quality Score
A strong discovery call gives every later KPI better input. A weak one creates false demand for demos, vague POCs, avoidable technical objections, and wasted SE capacity. Your discovery quality score should measure whether the SE uncovered the business problem, technical requirements, decision criteria, stakeholders, budget context, timeline, and competitive situation before delivery begins.
Use a simple rubric with a 1-to-5 score for problem clarity, success metrics, stakeholder map, budget, timeline, and competitive context. Those scoring levels are an internal measurement design, not an external benchmark. Apply the rubric to call recordings or structured SE notes, and keep the definitions stable so coaching data remains useful.
The formula can be:
Discovery quality score = points earned ÷ points available × 100
A hypothetical low score might show that the buyer described a technical pain but never stated what success means. The manager should coach the SE to ask for measurable outcomes, then schedule a follow-up before approving a custom demo. Another hypothetical deal might reveal that the prospect is evaluating several vendors, while the SE never asked how the decision will be made. That gap should trigger a discovery recovery plan.
Use the discovery call guide to align the AE and SE on what must be known before a demo.

Review at least one discovery call per SE each month if your team can support that cadence. Share the score with the AE as “what we know and what we still need,” not as a personal critique. Use patterns across the team to plan roleplays and enablement.
The 2025 State of Sales Engineering report places outcome, efficiency, and capacity measures together, including deal lift, competitive win rate, deal cycle time, and utilization. Discovery quality belongs at the front of that system because it determines whether later activity is well targeted.
3. Opportunity Qualification Score
SE capacity is too expensive to allocate by calendar order. The opportunity qualification score shows whether a deal fits your ideal customer profile and go/no-go criteria before significant technical work begins.
Build the score with sales leadership. Select five to seven essential criteria, such as solution fit, confirmed budget, active timeline, access to technical stakeholders, executive sponsorship, strategic alignment, and a credible business problem. Use a 1-to-10 scale and define every level. Shared definitions keep the score evidence-based instead of turning it into another opinion field in the CRM.
A hypothetical prospect could score 2 out of 10 because the company has weak fit and no stated budget. Assign that opportunity to a watch list or a short qualification conversation rather than a full POC. A deal could score 9 out of 10 when the customer fits the ICP, has a timeline and budget, and has involved the right stakeholders. That opportunity warrants early SE engagement.
Review scores during weekly pipeline meetings. Compare the AE's assessment with discovery evidence, and investigate disagreements rather than averaging them away. If competitive research reveals a standard platform commitment and lowers the score, choose deliberately among an ROI case, a narrow technical wedge, or a pass.
A qualification score signals staffing priority. It measures deal fit, not human worth or seller effort.
Set a minimum threshold for SE involvement, with exceptions documented by a sales leader. Track qualification scores alongside technical wins over time. Repeated wins from low-scoring deals indicate weak criteria. Stalled high-scoring deals show that a signal was overstated.
Use the PreSales KPI rollout framework to make the score part of pipeline governance, with clear ownership for reviewing scores, exceptions, and technical outcomes.
4. Demo-to-POC Conversion Rate
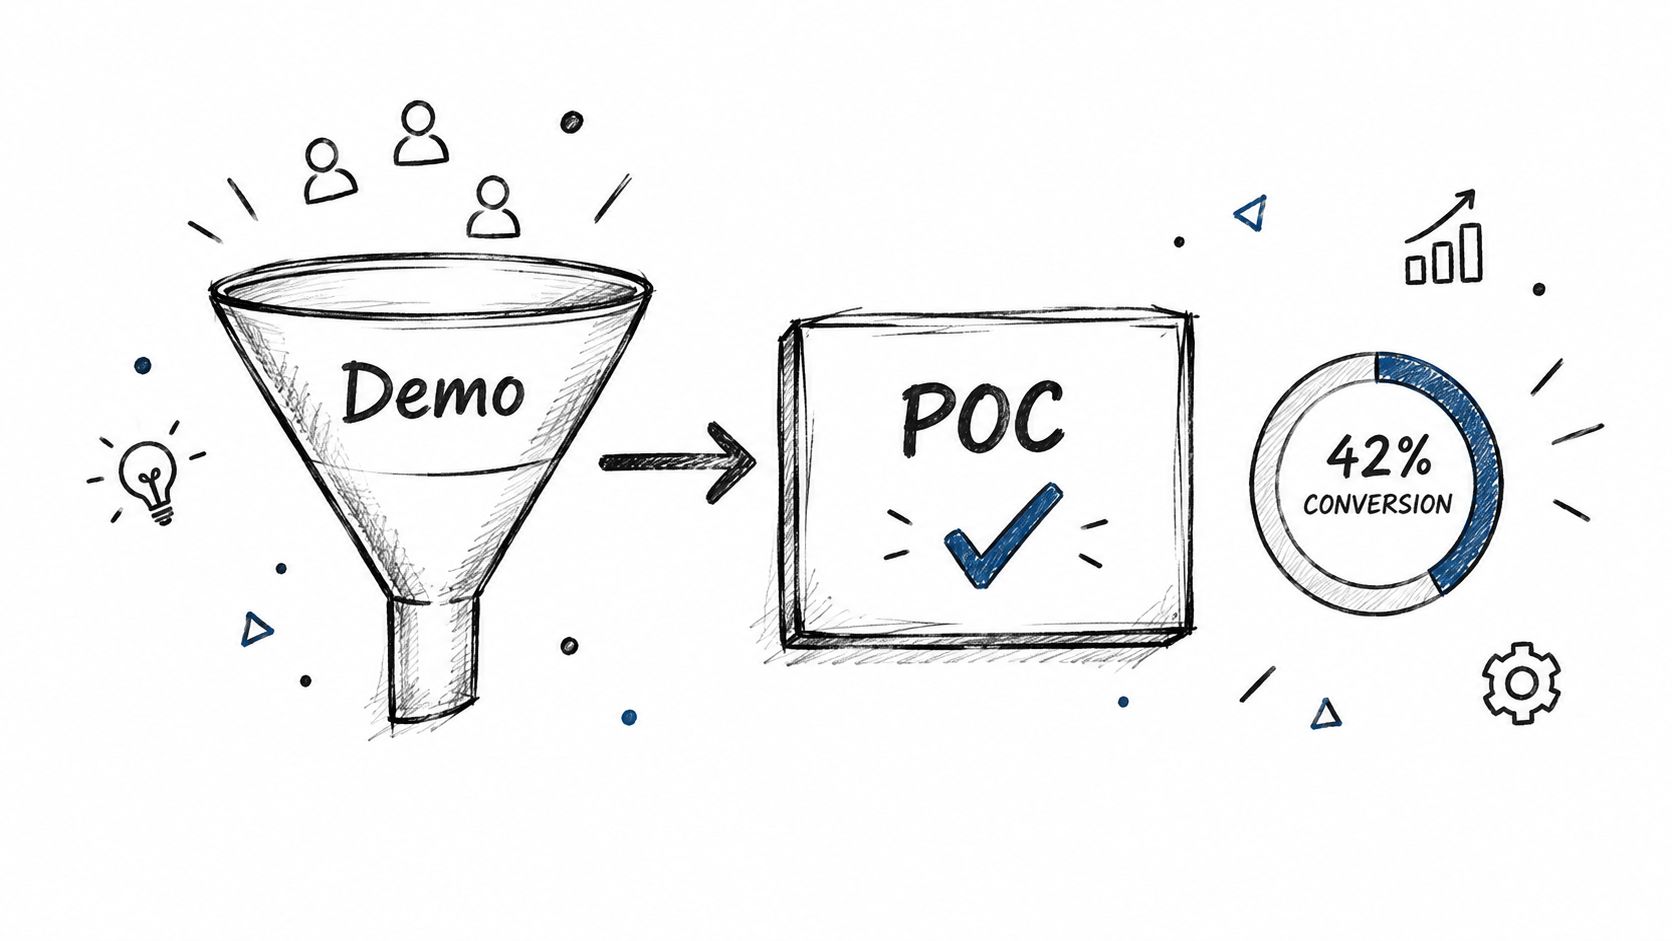
The demo-to-POC rate answers a direct question: did the technical conversation create enough relevance and confidence for the buyer to test the solution in a real environment? It's a stage-conversion KPI, not a proxy for demo quality by itself.
Define what counts as a POC. Require a formal agreement, a documented pilot plan, or a committed evaluation timeline. Don't count an enthusiastic follow-up message as a POC. Then calculate:
Demo-to-POC conversion rate = demos that progress to a formal POC or pilot ÷ qualifying demos × 100
Use hypothetical examples for coaching. If one SE converts 60% of qualifying demos and another converts 15%, compare discovery depth, use-case selection, stakeholder involvement, and next-step language before declaring a best practice. If a team rate falls from 40% to 25% after a product release, inspect the new feature narrative, demo flow, and buyer confusion. If one use case converts at 55% while another converts at 20%, prioritize the stronger use case while product and marketing investigate the gap.
The 2026 independent presales guidance cites 60% to 80% as a commonly targeted demo-to-next-step conversion range and describes discovery-to-demo timing of 3 to 10 business days. Those are external reference points, not targets you should copy without segment and funnel definitions.
Log every non-conversion reason, including weak fit, missing budget, competitive preference, unclear success criteria, or technical concern. Coach from recordings and preparation notes. Standardize approaches that repeatedly move qualified buyers forward, but don't reward an SE for forcing weak-fit customers into evaluations.
5. POC/Pilot Completion Rate
A POC can start with strong energy and still fail operationally. POC completion rate measures whether evaluations finish against the agreed scope, produce customer feedback, and reach a clear go or no-go decision.
Use this formula:
POC completion rate = POCs completed to an agreed decision ÷ POCs started × 100
Completion doesn't mean every test passed. A failed evaluation can be a high-quality outcome if the team reached a documented decision quickly and learned why the solution didn't fit. A stalled POC is different. It consumes capacity without producing technical evidence.
Your kickoff template should include:
- Success criteria: Document what the customer must prove and who accepts the result.
- Milestones: Set dates for setup, testing, review, and decision.
- Customer responsibilities: Name the people providing data, access, approvals, and feedback.
- Sync cadence: Schedule weekly or biweekly checkpoints before work starts.
- Scope control: Log additions and require a decision on each change.
- Escalation path: Identify who resolves blockers and how quickly they must respond.
A hypothetical evaluation planned for four weeks can stretch to three months when the customer adds use cases without a change process. A scope log exposes the cause. A separate hypothetical comparison may show one SE completing 90% of POCs while another completes 55%. Review kickoff quality, stakeholder access, checkpoint discipline, and scope management before turning the difference into coaching.
The 2026 independent presales guidance places enterprise proof-of-value success at 60% to 75% and POC cycle time at 2 to 6 weeks as reference benchmarks. Use them only with comparable definitions and segments.
“No success criteria at kickoff means no defensible POC outcome at close.”
Run a postmortem on every stalled evaluation. Feed recurring blockers into product, implementation, security, and sales operations rather than leaving the SE to absorb the failure alone.
6. Competitive Win Rate and Loss Analysis
Named competition gives your technical win data context. Competitive win rate measures how often you win against a specific rival, while loss analysis explains which technical, commercial, or positioning factor created the barrier.
Calculate:
Competitive win rate = wins against a named competitor ÷ closed opportunities where that competitor was named × 100
Require the AE to record competitive information at deal creation and close. “Lost to competition” is too vague. Capture the rival, use case, decision criteria, price concern, functionality gap, security issue, implementation concern, and stated preference.
A hypothetical team may lose to Competitor A in a data warehouse use case because SEs can't explain the relevant technical difference. The response is targeted product and competitor training, not generic demo coaching. Another hypothetical pattern might show stronger performance against Competitor B than Competitor C. Review the wins against B, identify the messages that mattered, and test whether those messages apply to C without overstating product capability.
Use a monthly loss review with product and sales leadership. Competitive data should change battle cards, discovery questions, demo paths, and roadmap conversations. It shouldn't become informal gossip circulated through chat.
The 2024 State of PreSales report identifies win rate, technical win rate, and attainment as leading impact KPIs, while also noting that sales-cycle speed and demo effectiveness are measured through conversion. That supports a balanced view. Competitive win rate explains where technical positioning succeeds or fails, while the broader technical win rate shows impact across the full opportunity set.
Keep the guardrail clear: don't blame the SE team for a product gap that the product team hasn't addressed. When loss analysis identifies repeated missing functionality, escalate it with evidence and segment context.
7. SE Resource Utilization and Capacity Planning
Utilization belongs in the leadership report, but it should not outrank technical impact. Utilization measures capacity consumption, not whether technical work advances qualified opportunities. An SE can spend a full week on weak demos and open-ended POCs while technical win rate and customer trust decline.
Define deal-focused time before measuring it. Count discovery, demos, POCs, proposal support, technical workshops, and other customer-facing work that contributes to a technical win. Exclude administration, internal meetings, training, and ramping.
Utilization = deal-focused SE time ÷ available working time × 100
Use a calendar audit, time-tracking tool, or manager estimate. Consistent definitions matter more than false precision. Review outliers monthly. If one SE spends 40 hours per week on deal work while another spends 15 hours against a similar pipeline, examine meeting load, assignment quality, ramp status, and productivity before judging performance.
The 2024 State of PreSales report includes attainment and sales-cycle speed among measures connected to PreSales impact. Capacity data belongs beside those measures, not above them. High utilization that produces weak conversion signals poor allocation, weak qualification, or excessive POC demand.
The plan notes for a mature team suggest 70% to 80% deal-focused utilization, with below 60% signaling a possible issue and above 90% creating burnout risk. Treat these as operating assumptions, not universal standards. Investigate whether low utilization reflects weak pipeline quality, internal meeting creep, ramping, or insufficient demand.
Forecast capacity each quarter against pipeline, segment complexity, POC load, and strategic priorities. A model that says the team needs 4.5 SEs while it has 3.5 should force a staffing or scope decision. Pair capacity forecasts with technical win rate and POC completion. Leadership should fund capacity that improves technical outcomes, not activity that merely fills calendars.
8. Customer Technical Satisfaction and Reference Ability
The sale doesn't end the SE's credibility test. Customer technical satisfaction and reference ability show whether the technical promises made during evaluation survived signature and early implementation.
Ask specific questions rather than relying on a general satisfaction score:
- Technical understanding: Did the SE understand the customer's technical needs?
- Accuracy: Did the SE describe capabilities and limitations accurately?
- Commitment quality: Did the team deliver what the evaluation plan promised?
- Handoff quality: Did implementation receive enough context to start well?
- Reference readiness: Would the customer recommend the solution for the specific use case?
A hypothetical survey might show one SE scoring 4.2 out of 5 for technical accuracy while another scores 3.5 out of 5. Review calls and demos for patterns. The lower result could reflect feature-heavy conversations that missed the customer's workflow. Another hypothetical case might involve an SE promising three use cases while only two work well after the sale. The corrective action is tighter scoping and more conservative commitments.
Survey at signature to capture the buying experience, then again at 90 days post-go-live to test whether the promised value held up. Track the customer, SE, use case, and implementation context. A reference is more useful when it names the technical problem the customer solved, not merely that the account is satisfied.
The 2026 executive KPI guidance argues that each KPI needs an owner, target, and decision trigger. Apply that discipline here. Customer feedback should trigger coaching, a handoff change, a product escalation, or a reference request.
Credit reference influence fairly. When a reference customer helps close a similar deal, record both the original SE's technical work and the SE who used the reference in the new evaluation. Don't turn customer relationships into an unstructured attribution contest.
8-Point Sales Engineer KPI Comparison
| Metric | Implementation complexity | Resource requirements | Expected outcomes | Ideal use cases | Key advantages | Key limitations |
|---|---|---|---|---|---|---|
| Technical Win Rate | Medium–High, needs attribution rules and AE alignment | Win/loss data, deal-stage tracking, periodic reviews | Measure SE influence on outcomes; validate technical credibility | Justifying SE ROI; assessing SE impact on deals | Directly links SE work to business outcomes; benchmarkable | Requires honest attribution; can be gamed; slow cycles hard to track |
| Discovery Quality Score | Medium, build rubric and scoring workflow | Call recordings/notes, reviewers, coaching time | Better qualification, fewer wasted demos/POCs, faster progression | Improving discovery skills; pre-demo qualification; coaching | Prevents wasted effort; creates consistent qualification and coaching signals | Time-consuming; scoring can be subjective; only useful if acted on |
| Opportunity Qualification Score | Low–Medium, define ICP criteria and thresholds | AE input, simple scoring tool, governance cadence | Prioritized SE engagement; fewer low-probability deals | Gatekeeping SE time; pipeline hygiene; capacity planning | Focuses SE effort on high-value deals; aligns sales and presales | Scores can be inflated/ignored; may miss strategic outliers |
| Demo-to-POC Conversion Rate | Low, track demo outcomes consistently | Demo logging, POC definition, analysis and coaching | Shows demo effectiveness; guides demo content and coaching | Optimizing demos, identifying high/low converting SEs/use cases | Clear, actionable metric for demo improvement and velocity | Depends on upstream qualification; POC definitions may vary |
| POC/Pilot Completion Rate | Medium, requires documented plans and monitoring | POC kickoff templates, milestone tracking, SE support time | More evaluations finish on time/scope; fewer stalled POCs | Managing evaluation phase; reducing open-ended pilots | Reveals POC management quality; prevents indefinite drains | Customers control completion; can incentivize narrow scopes |
| Competitive Win Rate & Loss Analysis | High, detailed win/loss capture and pattern analysis | Structured loss reasons, competitive intel, regular reviews | Identifies competitive strengths/weaknesses; informs training/product | Competitive positioning, messaging, product feedback loops | Targets training and messaging; alerts to market shifts | Requires high-quality data; reasons can be subjective; external factors matter |
| SE Resource Utilization & Capacity Planning | Medium, consistent tracking and modeling needed | Time tracking/calendar audits, capacity models, reviews | Data-driven hiring, balanced workloads, forecasted capacity | Headcount planning, workload balancing, spotting non-core work | Prevents over/under staffing; supports hiring/business cases | Tracking burden; forecasts uncertain; quality of time hard to measure |
| Customer Technical Satisfaction & Reference Ability | Low–Medium, survey design and follow-up process | Post-sale surveys/interviews, reference tracking, follow-ups | Early health signal; referenceable customers for sales | Post-signature health checks, reference generation, retention focus | Predicts renewals/expansion; creates reference assets | Survey timing/ownership affects reliability; attribution can be fuzzy |
Turn the KPI List Into a Leadership Operating Rhythm
A KPI list becomes useful when it changes what leaders do. Build a monthly operating view that starts with leading indicators, adds stage measures, and then provides outcome context.
Begin with discovery quality, opportunity qualification, and capacity. These measures tell you whether the team is working on the right deals and whether SE time is allocated well. Add demo-to-POC conversion and POC completion to show whether qualified opportunities are progressing through technical evaluation. Then add technical win rate, competitive loss analysis, and customer technical feedback to explain commercial influence and trust.
For every metric, show the same reporting fields:
- Definition: What event counts, and what doesn't?
- Formula: How is the value calculated?
- Period: Which month, quarter, or cohort does it cover?
- Sample size: How many opportunities, evaluations, customers, or responses sit behind it?
- Owner: Which person or team updates the field?
- Source system: CRM, call-recording platform, project workspace, survey tool, or support system.
- Trend: Is the measure moving, stable, or changing by segment?
- Segment: Which region, product, deal size, use case, or customer type does it describe?
- Decision: What staffing, coaching, qualification, product, or process action follows?
Don't rank SEs on raw demo counts or utilization alone. A high demo count can reflect weak qualification. High utilization can hide too many low-value evaluations. A strong report pairs activity and capacity with technical outcomes.
The MEDDPICC guide for Solution Engineers can help connect technical discovery to decision criteria, economic impact, and champion strength. Use the sales engineer role guidance to keep responsibilities clear across SEs, AEs, implementation, and customer success. If your team still mixes titles and expectations, clarify the distinction with this guide to Sales Engineer, Solution Engineer, and Solutions Consultant roles.
A hypothetical monthly leadership narrative might read like this: discovery quality declined in enterprise opportunities, qualification scores stayed stable, and demo-to-POC conversion fell. POC completion also weakened because kickoff plans lacked customer responsibilities. Technical win rate then softened in the same segment. The action is not “run more demos.” The action is to review discovery calls, require signed evaluation plans, coach stakeholder mapping, and inspect the affected competitive losses.
That narrative states what changed, why it changed, and what happens next. It doesn't pretend the numbers are a market benchmark. External reference points must stay named and linked. For example, the 2025 State of Sales Engineering benchmark shows that modern SE teams commonly combine outcome, efficiency, and capacity KPIs rather than relying on one measure.
Treat customer trust as part of the operating system, not a post-sale appendix. A technically successful deal that creates avoidable implementation disappointment is a weak PreSales outcome, even if the contract was signed. Review reference ability, technical satisfaction, scope accuracy, and escalation patterns with customer-facing leaders.
Keep the dashboard small enough to operate. The goal isn't to collect every possible sales engineer KPI. The goal is to identify where discovery, qualification, technical validation, competitive positioning, capacity, or trust is breaking, then assign a decision to the person who can fix it.
If your team needs a structured path for PreSales training selection, evaluate programs against these same standards. Look for repeatable discovery practice, deal-based coaching, POC discipline, usable KPI tools, and leadership enablement rather than a one-time presentation.
PreSales Unleashed GmbH operates SE Rockstars and the Trusted Advisor Academy, with structured content, live practice, templates, KPI tools, and leadership enablement for Solution Engineers and PreSales teams. If you're building a repeatable system for discovery quality, technical wins, evaluation management, and reporting, visit PreSales Unleashed GmbH to explore the program.